

History & Trend
Wind, speed, depth, heading and the other navigation values each have a chart of their recent past, with the trend drawn through it. The same chart is where you set limits on the value, so Zora tells you when it goes past them, on board or by email and SMS.
Open the chart
Tap the value:
- on a data widget, such as wind, speed, current or depth
- on the PND, the speed, heading, rudder, depth or wind figures
- on the anchor or mooring view, the heading
- in the data tab of the Tools panel; see Vessel state
The chart opens with the value's name and History & Trend in its title. It keeps moving while it is open.
Read the chart
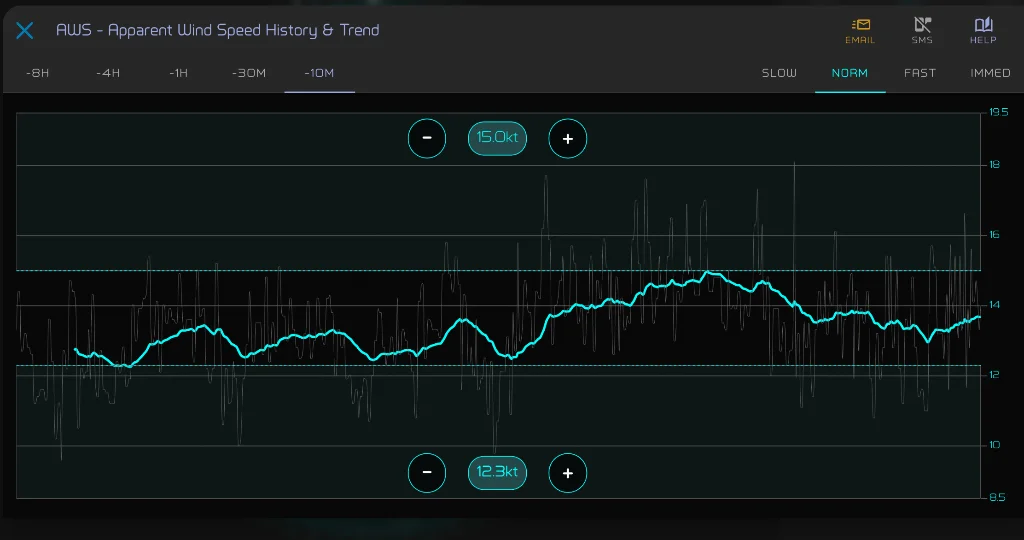
The thin grey line is the reading. The thick cyan line is the trend, the reading smoothed so a real change stands out from the gusts and the waves.
Period. The tabs at the top left choose how far back the chart goes, from -24H to -10M. The rudder goes from -3H to -1M. The chart opens on the shortest period until you pick another; this display then remembers your choice for that value.
Smoothing. The tabs at the top right set how smooth the trend is: SLOW, NORM, FAST or IMMED. IMMED follows the reading with no smoothing. The chart starts on NORM, or on the smoothing you set limits with; this display then remembers your choice for that value.
Wind angle and direction, heading, course, current direction and the rudder are drawn upright: time runs down the chart with the newest reading at the top, and the value runs across. Depth is drawn from zero and upside down, so deeper is lower, and it has no smoothing tabs.
Set limits
Two dashed cyan lines mark the highest and lowest point of the trend in view, each with its value. They are where a limit starts.
- Set a limit: tap the area above the upper line for an upper limit, or below the lower line for a lower limit. On an upright chart, the upper limit is on the right and the lower on the left. The limit is set at that line and turns amber, and the area past it is shaded. The shading brightens while the trend is past the limit.
- Move it: tap – or + beside the value. The limit moves by 0.5, or by 1 on an upright chart. On a line without a limit, this sets one.
- Type it: tap the value. Enter the upper Limit and lower Limit (on depth, when deeper than and when shallower than) and tap SAVE. Clear a field to remove that limit. The lower limit has to be below the upper one.
- Remove it: tap the shaded area again.
Close the chart with ✕ to save. The limits then hold for the whole boat, on every display, and survive a restart.
TIP
Set the smoothing before you set the limits. A slower trend rides over gusts and short spikes, so a limit on it warns you when the value has really moved.
When a limit is crossed
Zora watches the trend, at the smoothing you chose, and raises a notification when it goes past a limit. Depth has no smoothing, so its limits watch the depth itself. When the value comes back inside, the notification says it is back to normal.
You can set limits on the apparent wind speed and angle, the true wind speed and direction, the current speed and direction, depth, speed through the water, speed and course over ground, heading and the rudder.
Every value with limits is also listed under ALARMS in Notifications. To stop watching a value, remove both limits and close the chart.
Email and SMS
EMAIL and SMS in the chart's header send this value's alert to you ashore. Tap one to switch it on or off; the change takes effect straight away, without closing the chart.
| Icon | Means |
|---|---|
| Green | on, and cloud notifications are active |
| Orange | on, but cloud notifications are switched off: nothing is sent |
| Grey | off |
Cloud notifications are switched on in Notifications with LEAVING THE BOAT. Each value sends at most one message a minute. If the boat has no connection when a limit is crossed, the message waits and goes out once the boat is back online.
WARNING
Email and SMS need the boat to reach the internet. Keep a watch on board as well.